SAVE LIVES Direction arrows on roads assist tourist drivers
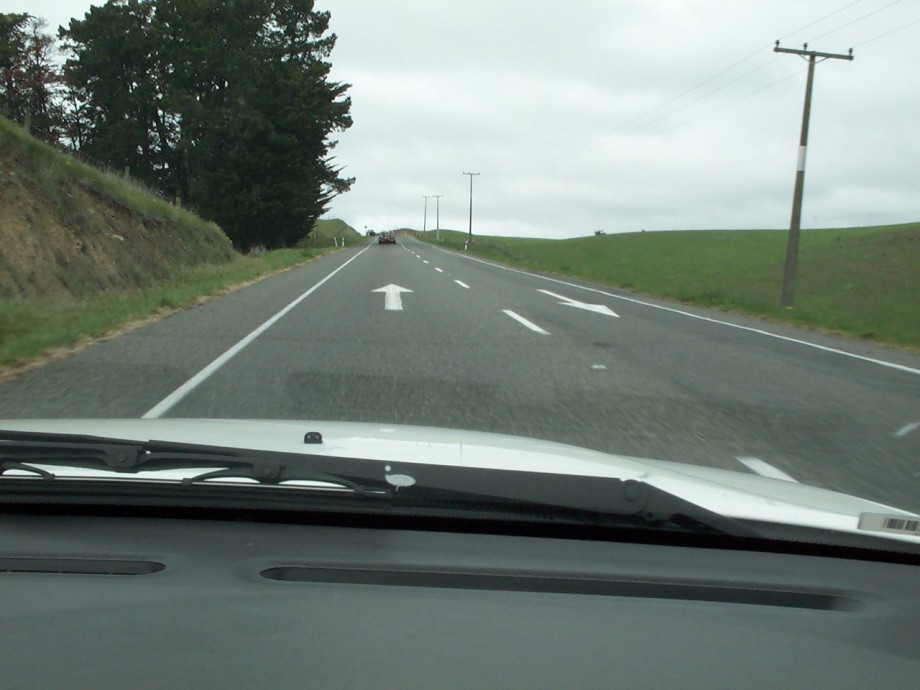 This petitions asks the Minister of Transport to make our roads safer for drivers and more user friendly for tourist drivers. We want more DIRECTIONAL ARROWS painted on roads at highway intersections and HOTSPOTS that show drivers which side of the road to merge to and drive on. We want more signs on highways to remind international drivers that in New Zealand we drive on the left side of the road. Too many tourist drivers are causing fatal accidents on our roads, something has to be done NOW to prevent more deaths.
The following statistics are from the NZ transport website. Overseas licence holders in crashes – Summary statistics Over the 5 years, 2010-2014, 5.7 percent of fatal and injury crashes involved an overseas licence holder. Over the same time-period, 3.8 percent of all drivers involved in crashes were overseas licence holders. At a local level the proportion of crashes that involve an overseas licence holder can vary markedly due to regional differences in the size of the visitor and immigrant populations and their driving patterns. In the South Island tourist areas crashes involving an overseas driver make up a quarter or more of all road crashes. About three-quarters of overseas licence holders in crashes (78 percent) are short-term visitors to New Zealand, 13 percent are overseas students and 9 percent are migrants. (Visitor status is not recorded for about 40 percent of overseas licence holders). The South Island has the highest proportion of short-term visitors in crashes (86 percent of overseas licence holders in crashes). For Auckland, only half the overseas licence holders in crashes are short-term visitors. Auckland has the highest proportion of new migrants (23 percent) and the highest proportion of overseas students (28 percent). The majority (68 percent) of short-term visitor crashes are on the open road, with two thirds of those being on state highways. For short-term visitors about a third of their urban crashes are on state highways, the major through routes in urban areas. For new migrants and students the pattern is much more similar to New Zealand licence holders with about 40 percent of crashes on the open road and less than 15 percent of urban crashes on state highways. At a national level over half (58 percent) of overseas licence holder crashes are on the open road but the pattern varies markedly between regions. For the West Coast and Southland regions about 90 percent of crashes are on the open road. The comparable figure for Wellington and Auckland is 34 percent. About a third of at-fault overseas licence holders failed to adjust to New Zealand rules or conditions. This rises to about a half for fatal crashes. Overseas licence holders (5 percent – 7 percent for drivers from countries that drive on the right and 3 percent for countries that drive on the left) are more likely to fail to keep left than New Zealand drivers (2.3 percent). For fatal crashes these rise to 18 percent for overseas licence holders and 12 percent for New Zealand drivers. For drivers involved in crashes, rental vehicle use by overseas licence holders (36 percent) is much higher than for other drivers (1 percent). Overseas licence holders make up nearly two-thirds (64 percent) of rental vehicle drivers in fatal and injury crashes. The use of rental vehicles is not spread evenly around the country. Rental vehicle drivers make up over two-thirds of overseas licence holders in crashes in the West Coast (72 percent) and Southland regions (70 percent). The lowest proportion of overseas drivers in rental vehicles is in Wellington (18 percent) and Auckland (11 percent). There is a much stronger seasonal variation in crashes for overseas licence holders than for New Zealand drivers. This is particularly so for short-term visitors who have over twice as many crashes in the 3 months January to March as in the 3 months May to July. The top 6 countries in terms of the number of drivers in crashes are Australia, Germany, UK, China, India and the USA. Combined, these 6 countries contribute over half (55 percent) of the overseas drivers in crashes. 4 The relative importance of these 6 countries has changed markedly over the last 10 years. The number of drivers from the UK has more than halved and the numbers from both China and India have more than doubled. There have been similar changes in the country of origin of short-term visitors to New Zealand. The mix of visitors, students and migrants is quite different for drivers from these 6 countries. So too is the age/sex profile, the use of rental vehicles and the regions and roads they crash on. Source : http://www.transport.govt.nz/assets/Uploads/Research/Documents/Overseas-drivers2015-15Jun15.pdf
Announcement from the administrator of this websiteWe have closed this petition and we have removed signatories' personal information.European Union's General Data Protection Regulation (GDPR) requires a legitimate reason for storing personal information and that the information be stored for the shortest time possible. 12 |